
Speakers: It’s not all about cost
 Cost won’t always tell you about some important aspects of speaker design and performance. Anthony Grimani outlines what you need to know.
Imagine 80,000 AV enthusiasts combing through at all manner of cool gear.
That’s what greeted me early in 2018 at the ISE 2018 show in Amsterdam, at which I was asked by CEDIA to teach a two-part course on home cinema audio and acoustics.
ADVERTISEMENT
The course was originally written by loudspeaker and acoustics guru Dr Floyd Toole.
Floyd is past president and silver and gold medal recipient of the Audio Engineering Society. He is also a senior research officer at the National Research Council of Canada, a CEDIA Lifetime Achievement Award recipient and a recently retired vice-president of acoustical engineering at Harman International.
In other words, a true industry heavyweight.
Clicking through 350 PowerPoint slides reminded me of the crucial performance aspects that factually describe a good speaker – something anyone in our business should know.
With a bit of attention, you can quickly learn to read the technical spec sheets for products, should the manufacturers reveal them. (If they don’t, talk to the sales rep and ask for them, and ask for them, and ask for them … until they send you even an unpolished set of the charts and data you need.)
Some of the information here seems quite technical, but you or someone on your team needs to be comfortable with it. Clients expect you to be an expert in the field.
Here are some of the vital aspects of performance that describe the sound quality of a speaker:
- Axial frequency response.
- Listening window average response.
- Early reflection average.
- Sound power response.
- Directivity index: sound power and early reflection.
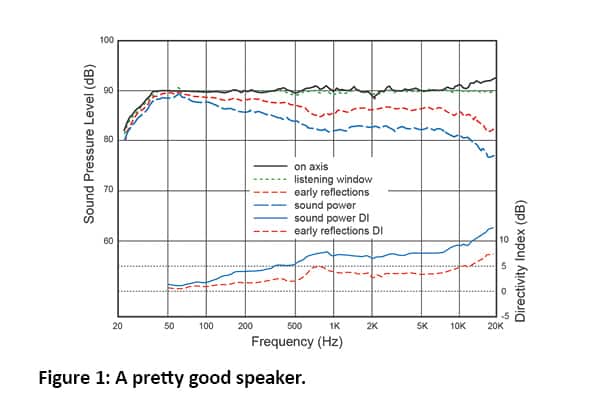 20The accompanying chart, which comes courtesy of Floyd, shows the data of a very good speaker.
The black line is measured frequency versus amplitude anechoic measured response. It should be as flat and smooth as possible. This tells you a lot about how carefully the designer worked on driver selection, woofer/mid/tweeter crossover networks and the enclosure.
The green dotted line shows the listening window, an average of measurements in an oval cone in front of the speaker (from +/-30 degrees horizontal off axis, and from +/-10 degrees vertical off axis).
This is extremely important, as it represents what a group of listeners arrayed in front of the speaker will actually hear.
The red dotted line is an average of off-axis measurements that show what will go out to the walls and come back to the listeners after one, two or three wall reflections (+/-60 degrees horizontal to +/-45 horizontal and vertical).
These measurements tell you a lot about the compatibility of speakers and reflective room surfaces. The curve should be as smooth as possible, with no sudden peaks or valleys, and gently starting to deviate from the axial response in the low frequencies.
The blue dotted line represents an area-weighted energy sum of 70 measurements made in a sphere around the speaker – the sound power.
It tells you what the tonal balance of total sound radiated into the room looks like. It should follow the same general smooth shape as the axial response, with a deviation starting in the low frequencies, and a preferably parallel line above about 500Hz.
Most of the sound reaching our ears is energy reflected off the room surfaces. This measure tells you a lot about the room-to-room consistency of the speaker design, and how easy it will be to make it sound good in the actual installation, using equalisation or placement adjustments.
All four of the data curves reveal a lot about the sound quality of the speaker design. There is no debate here – extensive research and listening tests over the years have proved that listeners prefer the sonic experience from speakers that show good results on these tests.
The next two curves on the chart have to do with the speaker’s ratio of direct-to-reflected sound, the directivity index (DI).
The curves are derived by subtracting the direct, or preferably the listening window, sound from either the sound power (solid blue line) or from the early reflection (dotted red line).
They represent how ‘beamy’ a speaker is. Generally, a larger reflective room with greater seating distance will benefit from speakers with a higher DI.
A DI of 6 means that the speaker radiation is hemispherical (half of the full sphere of sound power), which is appropriate for rooms up to 6m long.
Rooms of 10m generally benefit from speakers with a DI of up to 8 or 9 for better clarity, dialogue intelligibility and channel separation.
Here you must match the design to the room and the function in the room. Surround speakers, usually closer to the listeners, can benefit from lower DI than front speakers for better audience coverage of the immersive field.
Rooms with many hard surfaces and lots of sound reflections will benefit from higher DI speakers.
There are other elements to consider when selecting the right speaker for a project that mainly have to do with how loudly the system will play:
- Distortion at moderate levels (about 80dB at 1m from the speaker).
- Distortion at high levels (about 100dB at 1m from the speaker).
- Sensitivity for 2.8V input.
- Power handling.
- Maximum SPL capacity, using the AES2 method.
- Impedance curve from 20Hz to 20kHz.
- Price and margin.
- Size, weight, colour, shape, etc.
These aspects will be covered in a follow-up article – so stay tuned.
Chase Walton ([email protected]) contributed to this article.
-
ADVERTISEMENT
-
ADVERTISEMENT
-
ADVERTISEMENT
-
ADVERTISEMENT