
The 2009 Digital Atlas of Australia
With the onset of the global financial crisis, the Federal Government has tried to give the economy a boost – or two – by putting money into consumers’ pockets.
It has become a cliche to observe that some of the money is being used for buying plasma TVs and other household gizmos.
Certainly, the figures show that sales of digital devices did not slacken in 2008. Australians are still buying TVs, games consoles, PCs and digital cameras in record numbers. Things may have dropped off in recent months as harder times started to bite, but the numbers don’t reflect any change yet.
ADVERTISEMENT
Connection Research has recently released the second edition of The Australian Digital Atlas, which looks at the installed base and shipment figures of a range of digital technologies and devices. The atlas tells us a lot about how we buy and use technology – especially now that we have two years’ data to compare.
Australians bought 1.5 million flat panel (plasma, LCD and projection) TVs in 2008. Flat panels are now found in nearly half of all homes, compared with less than one-third at the end of 2007.
They also bought a similar number of laptop and desktop PCs, laptops overtaking desktops in sales for the first time. Nearly two-thirds receive digital TV, and more than that are on broadband Internet.
The Australian Digital Atlas uses extensive consumer research overlaid on national census data to paint a detailed picture of Australians’ use and ownership of consumer digital technology.
It takes data from Connection Research’s Connected Home surveys, which ask thousands of consumers about their household’s use of technology, and marries that to extensive demographic analysis from the Australian Bureau of Statistics.
The atlas analyses technology use for 10 electronic device types (eg: PCs, TVs, games consoles, digital cameras) and four household connectivity technologies (broadband and dial-up Internet, pay TV and digital TV).
It determines how many devices there are, on average, in each household, and the proportion of households with the device or the technology in use.
The analysis is broken down by Australia’s 65 Statistical Regions – the ABS geographical measures most closely aligned with population.
The Australian Digital Atlas uses extensive consumer research overlaid on national census data to paint a detailed picture of Australia’s use and ownership of consumer digital technology.
This regional analysis provides a unique insight into household technology use in Australia, to a degree not previously possible. The figures vary substantially by location, depending on demographic factors, such as the adult/child ratio and household income levels, and other factors.
There are some interesting findings. Did you know that digital TV is more popular in Tasmania than in any other State? (That’s because they trialled digital-only channels there first.) Or that the ACT has the highest proportion of home computers? Or that flat panel TVs are least likely to be found on the north coast of NSW?
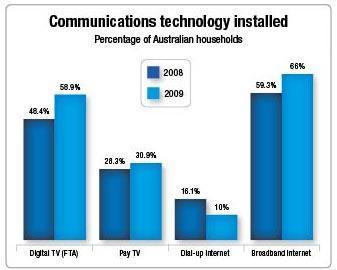
Sixty-three percent of Australian homes now have digital free-to-air TV, and 31% have pay TV. Both technologies are more likely to be found in affluent areas, but other factors are equally important.
The Northern Territory has the highest proportion of pay TV users, because of the relatively limited scope of free-to-air in that region.
Six of the top 10 regions for pay TV are in suburban Sydney, indicating the greater success of the service in that city than in other capitals. The lowest penetration, with only 16% of households, is in Northern NSW.
The proportion of households with digital TV grew substantially in 2008, but the proportion using pay TV has almost levelled out.
Australia is going broadband – 70% of homes have the service. About 10% are still on dial-up Internet, but the number is rapid falling as broadband becomes commonplace.
Seventy-three percent of homes have a desktop PC, and 49% have a laptop. Many homes have both. Laptops are most likely to be found in wealthier suburban areas, whereas desktops are more popular in the bush.
The ACT has the highest proportion of homes with a computer, at nearly 90%, consistent with the territory having the highest proportion on broadband. But, as with Internet connection, high PC ownership is not necessarily an urban phenomenon – the second-highest penetration is in outback Western Australia.
The typical house has two TVs – on average, 1.4 CRT TVs and 0.6 flat panel TVs. CRT TVs are often kept when flat panels are purchased and usually find their way into other parts of the house, such as children’s bedrooms.
There are well over three million flat panel TVs in Australian homes, from a standing start just a few years ago. Prices have dropped a lot in recent years, but they are still big-ticket items for most households.
Flat panel TVs are most likely to be found in wealthier areas – the top five regions are in the northern and eastern suburbs of Sydney, and in the ACT.
DVD players, once expensive, are now so cheap that their use is almost universal – they are found in 88% of households. With an average number per household of 1.4, that means many households have two or more.
DVD recorders are also becoming popular as the price drops – 30% of households have one, and a few have multiple devices.
The games console market in Australia has grown considerably in recent years with the release of new models from all the big suppliers. Forty-nine percent of Australian homes have at least one console, and the average of 0.8 per household means that ownership of multiple consoles is common.
There is high penetration is in the Northern Territory, and in the outer suburbs of Sydney and Brisbane.
More than a million consoles were purchased in 2008, and inner-city households accounted for a slightly higher proportion. Games consoles are not just for kids: urban sophisticates are in the market too.
In a few years digital cameras have gone from expensive oddity to mainstream device – 91% of homes now own at least one, many own two or more. Ownership is widely spread and not dictated by income levels or geography.
And, as with mobile phones, cameras continue to be replaced. More than two million more were acquired by Australian households in 2008.
Digital camcorders are more expensive but still found in 32% of homes. Ownership of multiple devices is not common.
What does it all mean? It means that Australia’s love affair with digital gadgetry continues unabated – at least it did in 2008.
The Australian Digital Atlas accounts for devices installed as at the end of the year, and the changes in that year. There is no doubt that the economy has deteriorated since December 2008, but the evidence is that Australians are still buying, albeit in lower numbers.
The real effect of the economic downturn on consumer sales will not be apparent for some time. Whatever the case, The Australian Digital Atlas will continue to track the numbers, illustrating who owns what, and where.
-
ADVERTISEMENT
-
ADVERTISEMENT
-
ADVERTISEMENT
-
ADVERTISEMENT